Trusted Arizona Financial Advisor: (480) 305-2038
Client Center
By all accounts it has been a phenomenal run for stocks. Through the end of 2017, the S&P 500 has had a positive total return in 19 of the last 20 quarters. The S&P 500 recorded a loss of 0.8% in the first quarter of 2018. This is the ninth time since 1990 that the stock market was negative during the first three months of the year. The S&P 500 went on to record a positive return for the entire year in five of the previous eight years that started with a loss (1992, 1994, 2003, 2005 and 2009) and suffered full-year of losses in the other three years (1990, 2001 and 2008).
It’s also clear that market volatility is back in 2018 versus the remarkably low volatility we experienced in 2017. To put things into perspective, the S&P 500 in 2017 had a total of nine 1% gain or loss trading days. In the first quarter of 2018 alone, the S&P 500 has had more than 20 1% gain or loss trading days. Given the uptick in volatility and panic inducing, sensationalized media coverage, I would like to provide you with three tips to help you stay focused on your long term goals and avoid undue stress that can accompany short term declines in the market.
1. Tune out the news and don’t act on emotion
In case you didn’t know, the news media outlets may not have your financial interest in mind. Their goal sometimes is to keep you in fear and tuned in for better ratings. Market pull backs are normal and should be expected in exchange for the opportunity of achieving long term growth.
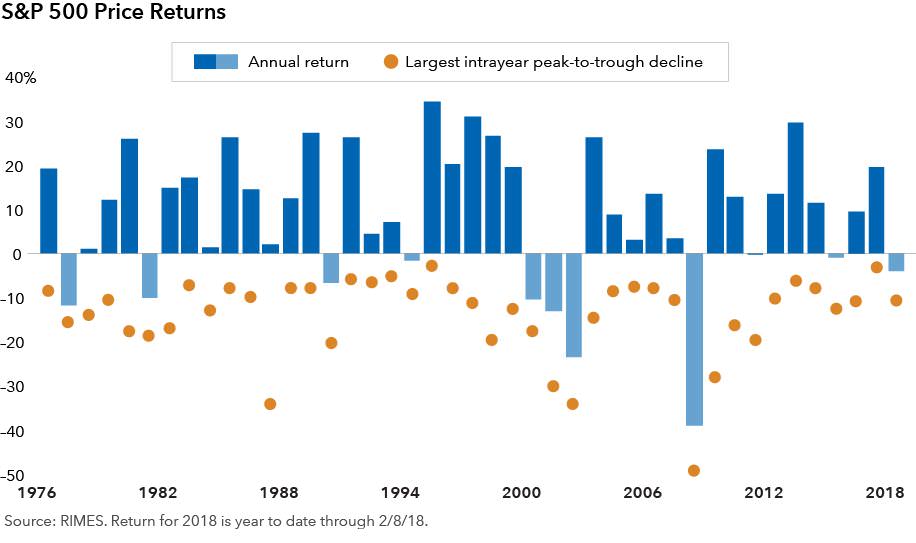
As demonstrated by Nobel Prize-winning psychologist, Daniel Kahneman, loss-aversion theory says that people feel the pain of losing money more than they enjoy gains. Naturally, investors flee the market during sudden, sharp declines and in the same way, greed motivates them to jump back in when stocks are on the rise. Both of these natural impulses can be devastating to your long term goals, but investments rooted in proper education, unbiased research and proven strategies can overcome the impulse and pull of emotion.
Below is a chart showing intra-year declines (orange dot) of the S&P 500 as well as annual year end returns (blue bar):
2. Change your investments proactively, not during market declines
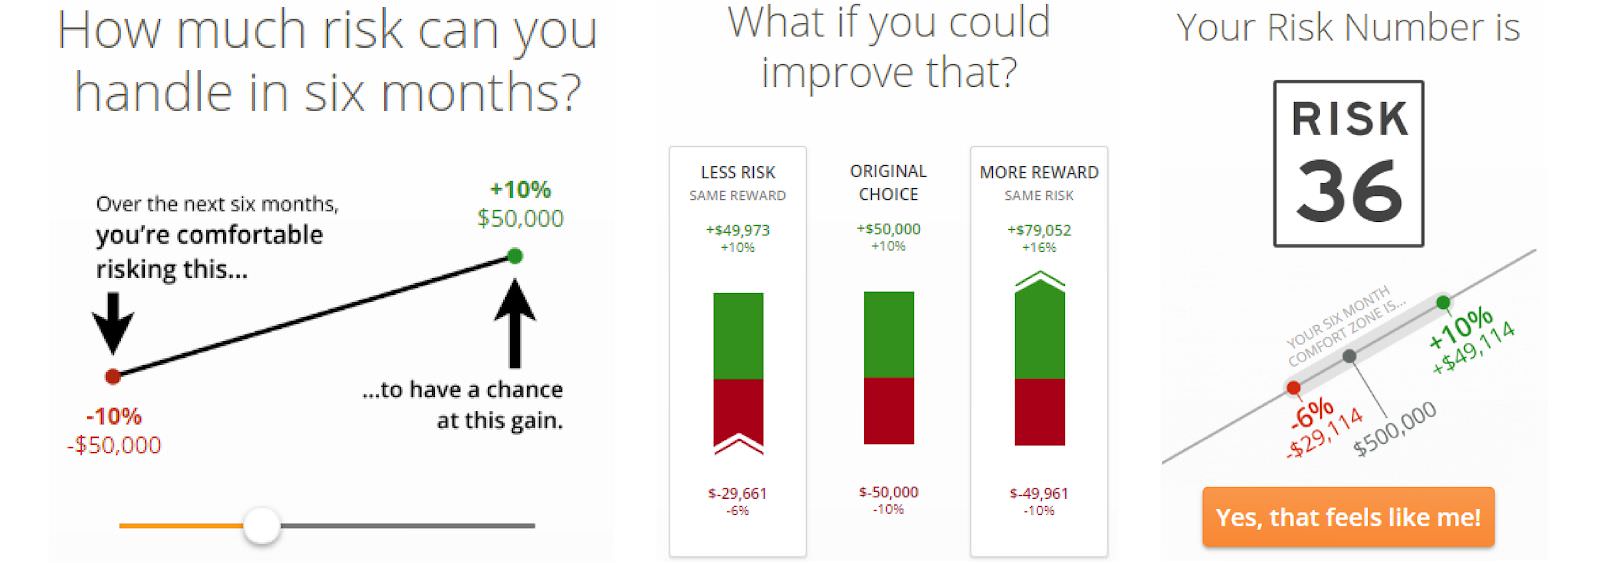
Riskalyze Services are for informational purposes only and do not constitute investment advice or an investment recommendation.
Ideally, you have taken the time to properly assess your risk tolerance and aligned your investments (as shown above) with your ability to endure volatility. If done properly, the ups and downs in your portfolio shouldn’t cause you to have a knee jerk reaction at inopportune times. I recommend stress testing your portfolio to see how it may have performed in both good and bad years.
Below is an example of a stress test:
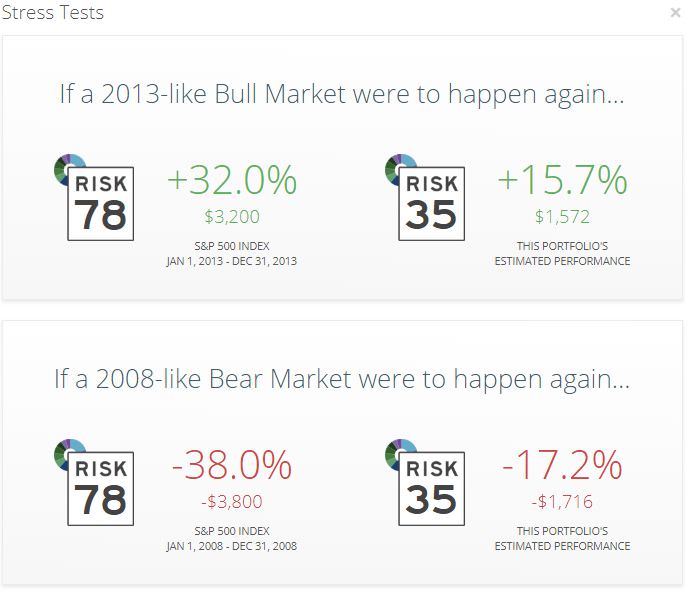
Riskalyze Services are for informational purposes only and do not constitute investment advice or an investment recommendation.
3. Be patient, your investments may thank you later
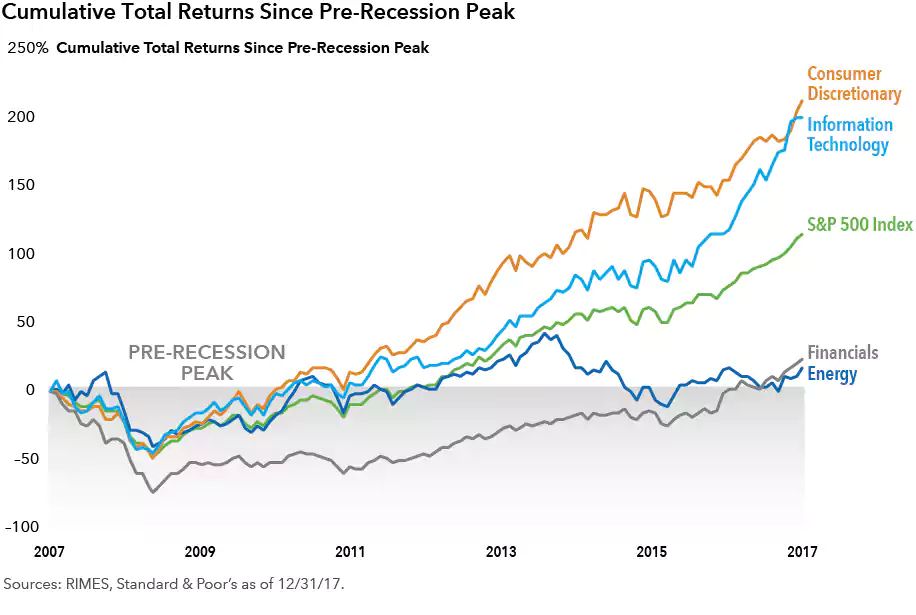
It is almost impossible for anyone to accurately predict short-term market moves, and investors who sit on the sidelines risk losing out on periods of meaningful price appreciation that may follow sharp market downturns. The visual below shows how allowing emotion and impatience to dictate your investment decisions can affect your long-term financial goals.
Many let emotion get the best of them during the 2008 and 2009 market downturn causing them to sell investments in their retirement accounts resulting in significant losses. Moreover, many did not reinvest for several years and missed out on several high growth years that followed.
This chart clearly illustrates how patience pays. One year losses are common, however; a blend of stocks and bonds have not suffered a negative return in any five-year rolling period. This information does not imply that all future five-year rolling periods will mirror the past. However, understanding historical market data is a powerful tool to “fight the fear” that market volatility can bring about. Past performance does not guarantee future results.
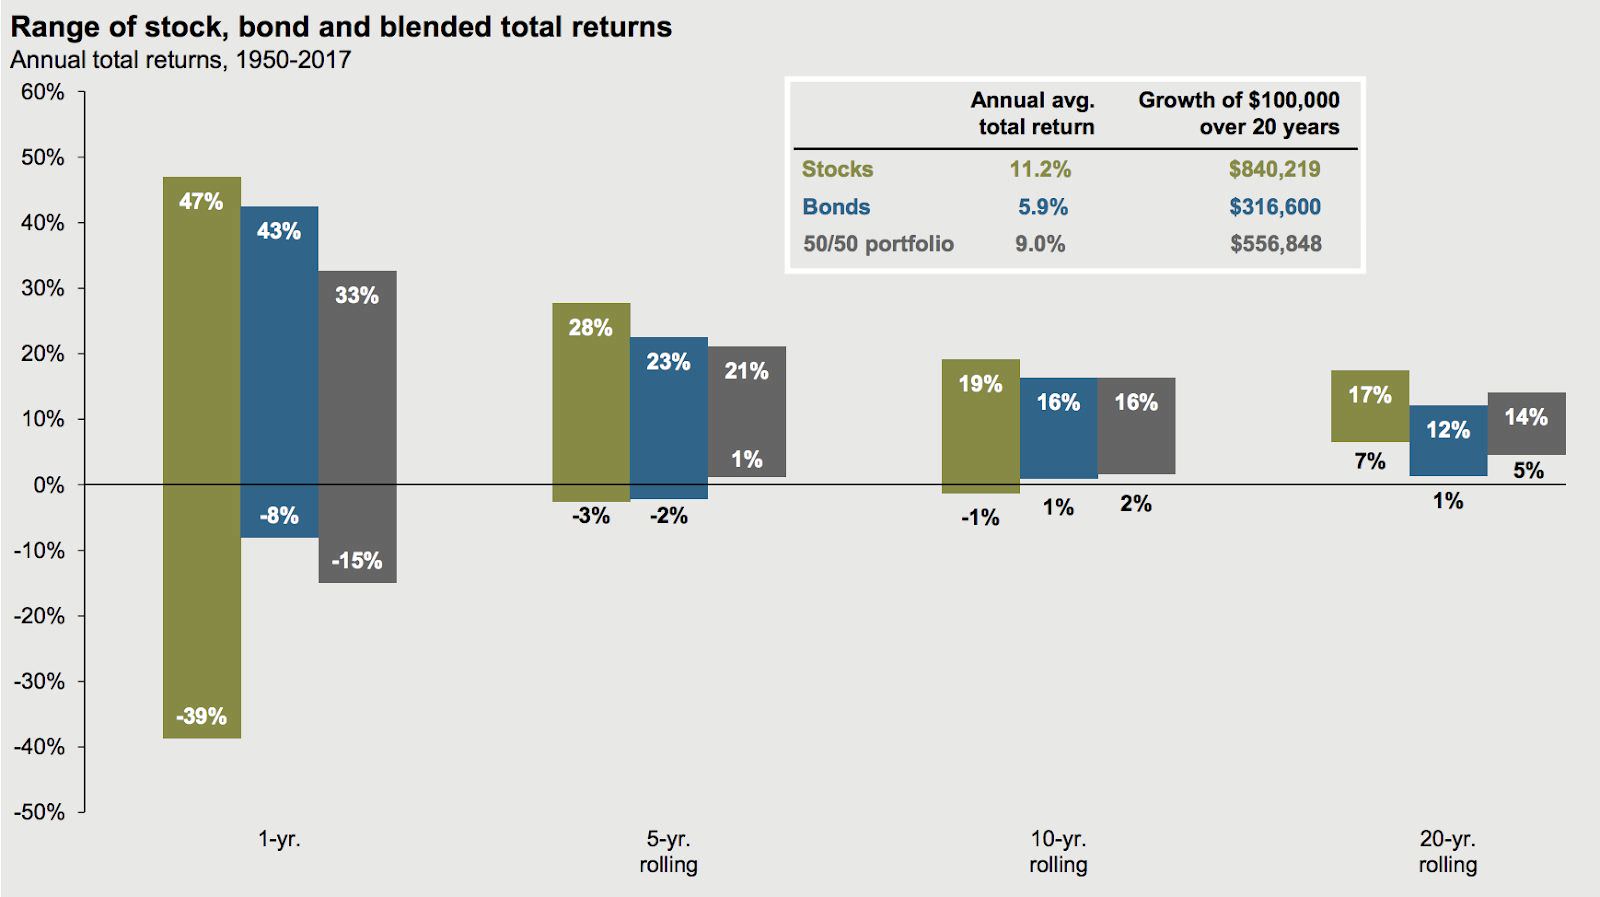
Source: Barclays, Bloomberg, FactSet, Federal Reserve, Robert Shiller, Strategas/Ibbotson, J.P. Morgan Asset Management. Returns shown are based on calendar year returns from 1950 to 2017. Stocks represent the S&P 500 Shiller Composite and Bonds represent Strategas/Ibbotson for periods from 1950 to 2010 and Bloomberg Barclays Aggregate thereafter. Growth of $100,000 is based on annual average total returns from 1950 to 2017. Guide to the Markets – U.S. Data are as of March 31, 2018. Past performance doesn’t guarantee future results. Examples are for illustrative purposes only. Riskalyze Services are for informational purposes only and do not constitute investment advice or an investment recommendation. Riskalyze Services are for informational purposes only and do not constitute investment advice or an investment recommendation.

Call to our office at any time

Our support team

16430 N Scottsdale Rd
Suite 110, Scottsdale, AZ 85254

8:00a - 4:30p
Monday to Friday
Whether it's financial planning or investment management or both, we believe confidence should drive every money decision you encounter.


